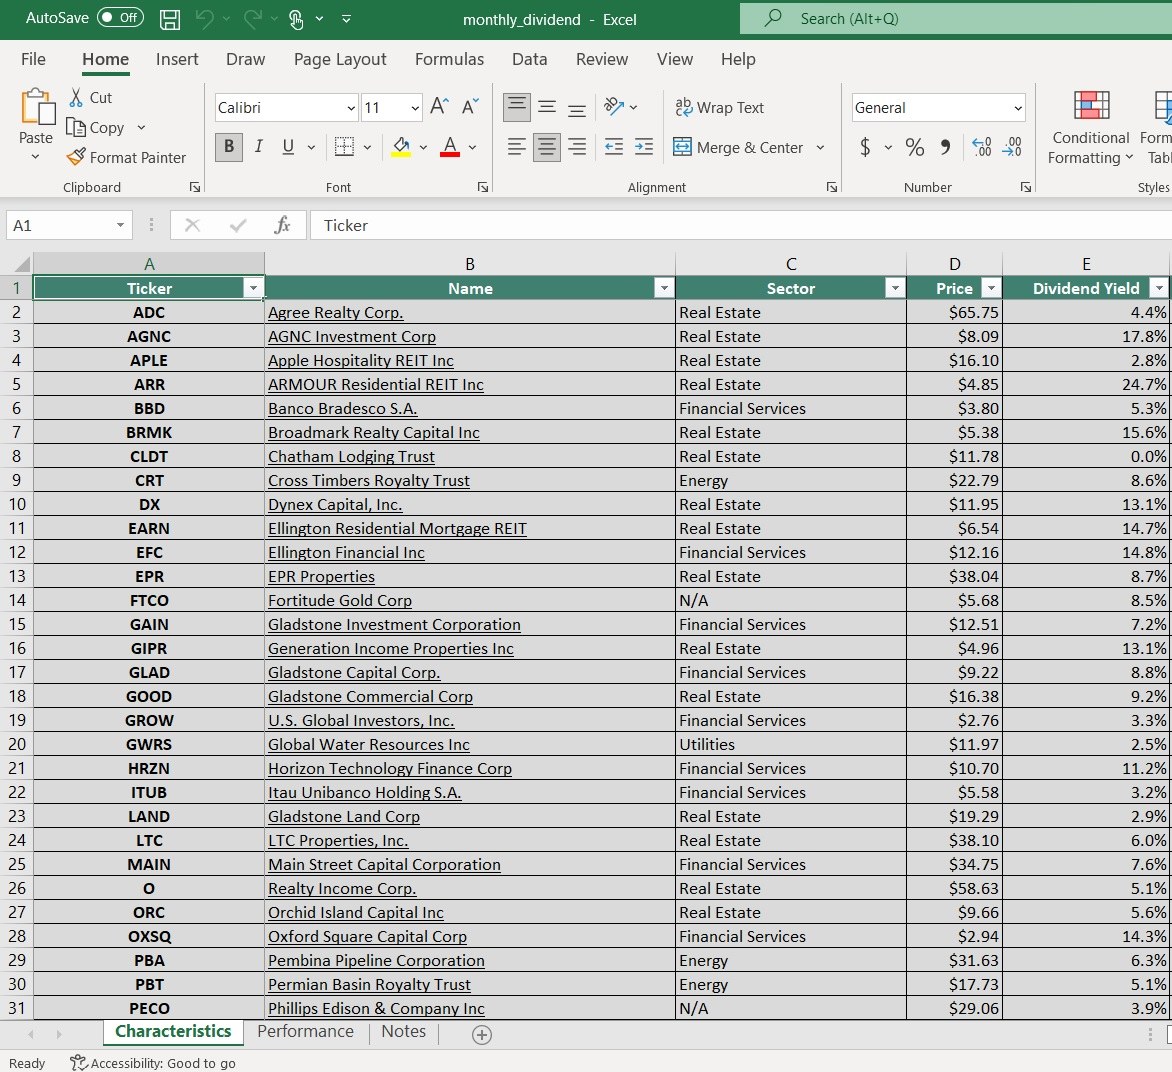
High-yield stocks that pay monthly dividends provide a compelling mix of:
- Current income
- Monthly payouts
This article analyzes the 20 highest-yielding monthly paying dividend stocks.
The following 20 monthly dividend stocks have high dividend yields above 10%. Stocks are listed by their dividend yields, from lowest to highest.
Yields follow the November 3rd, 2026 Sure Analysis Research Database. Supplemental payments, variable distributions, and dividend changes announced for future months are discussed in the relevant company sections.
The list excludes royalty trusts, whose payouts can fluctuate sharply with commodity prices, production volumes, and other factors outside management’s control.
Note: Treat this list as a short list for further research. Many high-yield monthly payers also carry significant risks. Due diligence and an understanding of this risk is essential before investing.
You can instantly jump to an individual section of the article by utilizing the links below:
- High-Yield Monthly Dividend Stock #20: Gladstone Commercial Corporation (GOOD)
- High-Yield Monthly Dividend Stock #19: MSC Income Fund (MSIF)
- High-Yield Monthly Dividend Stock #18: Trinity Capital (TRIN)
- High-Yield Monthly Dividend Stock #17: Himalaya Shipping (HSHP)
- High-Yield Monthly Dividend Stock #16: Ellington Financial (EFC)
- High-Yield Monthly Dividend Stock #15: PennantPark Floating Rate Capital (PFLT)
- High-Yield Monthly Dividend Stock #14: Timbercreek Financial Corp. (TBCRF)
- High-Yield Monthly Dividend Stock #13: Stellus Capital (SCM)
- High-Yield Monthly Dividend Stock #12: PennantPark Investment Corporation (PNNT)
- High-Yield Monthly Dividend Stock #11: AGNC Investment Corporation (AGNC)
- High-Yield Monthly Dividend Stock #10: CION Investment Corporation (CION)
- High-Yield Monthly Dividend Stock #9: Horizon Technology Finance (HRZN)
- High-Yield Monthly Dividend Stock #8: BCP Investment Corporation (BCIC)
- High-Yield Monthly Dividend Stock #7: Dynex Capital (DX)
- High-Yield Monthly Dividend Stock #6: Saratoga Investment Corp. (SAR)
- High-Yield Monthly Dividend Stock #5: ARMOUR Residential REIT (ARR)
- High-Yield Monthly Dividend Stock #4: Orchid Island Capital (ORC)
- High-Yield Monthly Dividend Stock #3: Prospect Capital (PSEC)
- High-Yield Monthly Dividend Stock #2: Invesco Mortgage Capital (IVR)
- High-Yield Monthly Dividend Stock #1: Oxford Square Capital (OXSQ)
High-Yield Monthly Dividend Stock #20: Gladstone Commercial Corporation (GOOD)
- Dividend Yield: 10.4%
Gladstone Commercial Corporation is a real estate investment trust that owns industrial and office properties across the United States, generally leased to individual tenants under long-term net leases.
Its strategy has increasingly emphasized industrial properties, although office exposure and tenant concentration continue to affect the portfolio’s risk.
In its second-quarter 2026 results, revenue increased 5.0% sequentially to $44.0 million, while Core FFO rose to $0.38 per share from $0.35.
Core FFO of $18.3 million covered the $0.30 quarterly common dividend. However, a lease-termination fee helped the quarter, so investors should assess coverage using recurring rental income as well.
The portfolio was 98.7% occupied as of June 30th, with a weighted average remaining lease term of 7.1 years. Gladstone collected all cash rent due during the quarter and acquired a fully occupied industrial property for $22.8 million.
On October 13th, the company maintained its $0.10 monthly common dividend for October, November, and December. That $1.20 annual rate produces the spreadsheet’s 10.4% yield.
Sure Analysis forecasts $1.40 of FFO per share for 2026, implying an annual payout ratio of about 86%.
Long leases support income visibility, but refinancing costs, tenant credit, leasing expenses, and remaining office exposure warrant attention. Third-quarter results are scheduled after the market closes on November 3rd.
High-Yield Monthly Dividend Stock #19: MSC Income Fund (MSIF)
- Dividend Yield: 11.1%
MSC Income Fund is a business development company advised by a Main Street Capital subsidiary.
It lends mainly to private-equity-backed companies and co-invests with Main Street in lower-middle-market businesses, combining recurring interest income with selective equity upside.
Second-quarter 2026 total investment income was $35.7 million. Net investment income was $12.0 million, or $0.26 per share, while adjusted NII was $14.9 million, or $0.33 per share.
Net asset value increased 4.0% sequentially to $16.51, and non-accruals were 1.9% of investments at fair value.
The company declared regular monthly dividends of $0.11 for October, November, and December, plus a $0.03 supplemental distribution payable in December from undistributed taxable income.
Adjusted NII exactly covered the $0.33 regular quarterly total, but did not cover the supplemental payment by itself.
In an October 8th portfolio update, MSC Income reported $62.2 million of new or increased private-loan commitments and $61.4 million of funded investments during the third quarter.
The private-loan portfolio totaled $849.6 million at cost across 81 companies at September 30th, with 90.1% in first-lien secured debt. These activity figures precede the full third-quarter earnings release.
Its September $150 million notes offering carried a 6.83% coupon and was intended to refinance 4.04% debt maturing in October, increasing the borrowing cost.
Accretive repurchases, strong first-lien positioning, and the $16.51 NAV are constructive, but leverage, refinancing costs, and the gap between GAAP and adjusted NII merit attention.
Deep Dive: Click here to download (for free) our most recent 3-Page Sure Analysis PDF report on MSC Income Fund (MSIF).
High-Yield Monthly Dividend Stock #18: Trinity Capital (TRIN)
- Dividend Yield: 11.9%
Trinity Capital is an internally managed business development company and alternative asset manager lending to growth-oriented businesses.
Its platform spans sponsor finance, equipment finance, technology lending, asset-based lending, and healthcare and life-sciences credit.
Second-quarter 2026 total investment income increased 25.5% year-over-year to $87.2 million.
Net investment income reached a record $46.0 million, or $0.51 per share, while net asset value rose sequentially to $13.47 per share.
The $2.7 billion portfolio covered 190 companies. First-lien loans represented 89.3% of the debt portfolio, while non-accruals were 0.8% of debt investments at fair value.
Trinity maintained its $0.17 monthly dividend for October through December, marking seven years of consistent or increased regular distributions.
Second-quarter NII exactly matched the $0.51 quarterly dividend total, leaving little current cushion.
An October 8th portfolio update reported $880 million of new commitments and $614 million of funded investments during the third quarter. Full third-quarter results are scheduled for November 4th.
Trinity also priced $350 million of 7.50% unsecured notes due in January 2032 on September 30th, with proceeds earmarked primarily to repay its KeyBank credit facility.
The longer-dated capital supports liquidity and portfolio growth, but the 7.50% coupon raises the return hurdle for new investments.
Investors should balance Trinity’s strong origination engine, internal management, and low non-accruals against leverage, venture-credit risk, funding costs, and the possibility that rapid deployment outpaces credit controls.
Deep Dive: Click here to download (for free) our most recent 3-Page Sure Analysis PDF report on Trinity Capital (TRIN).
High-Yield Monthly Dividend Stock #17: Himalaya Shipping (HSHP)
- Dividend Yield: 13.2%
Himalaya Shipping is a Bermuda-based dry-bulk carrier with 12 Newcastlemax vessels in operation.
Its modern ships use liquefied natural gas and scrubbers, while most charters are linked to the volatile Capesize freight market.
Second-quarter 2026 time-charter revenue reached $53.3 million, representing gross time-charter-equivalent earnings of about $50,600 per day.
Net income was $24.6 million, and EBITDA was $44.0 million, reflecting much stronger charter rates than one year earlier.
Operating performance strengthened further in September. In its October 7th commercial update, Himalaya reported average gross time-charter-equivalent earnings of about $65,800 per day, including a $2,300-per-day scrubber benefit.
That compared with a $49,209 average for the Baltic 5TC Capesize Index during the month.
The board approved a $0.28-per-share cash distribution for September, up from $0.25 for August.
The 13.2% yield shown here uses Sure Analysis’ $2.00 annual distribution assumption. It does not annualize the latest variable monthly payment, which can change rapidly with operating cash generation.
The strong recent freight environment supports near-term income, but investors should not mistake it for a fixed dividend commitment.
Capesize rates, charterer performance, vessel availability, financing costs, and shipping-industry cyclicality will determine future distributions.
High-Yield Monthly Dividend Stock #16: Ellington Financial (EFC)
- Dividend Yield: 13.5%
Ellington Financial owns residential and commercial mortgage assets, consumer loans, corporate credit, and mortgage-backed securities.
It also owns Longbridge Financial, a reverse-mortgage originator and servicer that adds operating income beyond the investment portfolio.
In the second quarter of 2026, Ellington generated net income of $54.4 million, or $0.43 per common share, and adjusted distributable earnings of $75.5 million, or $0.60 per share.
Book value increased to $13.61 per share after $0.39 of quarterly dividends, while the adjusted long investment portfolio grew to $4.50 billion.
Longbridge originated $589.7 million of loans, 38% more than one year earlier, and its HMBS issuance share reached 29%.
Ellington maintained its $0.13 monthly dividend, including the payment scheduled for November 30th.
Adjusted distributable earnings comfortably covered the $0.39 quarterly payout.
In an October 27th update, the company estimated September 30th book value at $13.53 per share, including the effect of the relevant $0.13 dividend. The estimate remains subject to completion of quarter-end valuations.
The modest decline from June contrasts with sharper losses at several Agency mortgage REITs, but second-quarter recourse debt-to-equity of 1.9 times and total debt-to-equity of 9.2 times show the importance of leverage.
Dividend durability still depends on recurring portfolio income, funding access, housing conditions, securitization markets, and disciplined hedging as rates and spreads move.
High-Yield Monthly Dividend Stock #15: PennantPark Floating Rate Capital (PFLT)
- Dividend Yield: 13.8%
PennantPark Floating Rate Capital is a business development company focused primarily on floating-rate senior secured loans to U.S. middle-market businesses.
For the fiscal third quarter ended June 30th, 2026, the investment portfolio totaled $2.50 billion across 159 companies and yielded 9.8% on debt investments.
Total investment income increased to $66.1 million, while net investment income was $25.9 million, or $0.26 per share.
Net asset value declined 2.0% sequentially to $10.26 per share, and four portfolio companies were on non-accrual, equal to 0.4% of fair value.
PennantPark’s October declaration maintained a $0.08 base monthly dividend and a $0.0033 supplemental payment, paid on November 2nd.
The spreadsheet yield uses the $0.96 annualized base dividend, while the supplemental amount adds modest income if continued.
Quarterly NII slightly exceeded the current combined three-month run rate.
On August 31st, the PennantPark Senior Secured Loan Fund joint venture reset its $316.7 million CLO, reducing the weighted-average debt cost from SOFR plus 2.31% to SOFR plus 1.82% and extending the maturity to April 2038.
The lower financing spread should support joint-venture earnings, but the NAV decline and falling loan yields limit the overall cushion.
Investors should monitor credit quality, recurring NII coverage, leverage, and further rate compression.
High-Yield Monthly Dividend Stock #14: Timbercreek Financial Corp. (TBCRF)
- Dividend Yield: 13.9%
Timbercreek Financial Corp. is a Canadian non-bank lender providing shorter-duration, structured commercial real estate financing.
Its portfolio is concentrated in first mortgages on income-producing properties, particularly multifamily assets in major Canadian markets.
Second-quarter 2026 net investment income was C$24.9 million, while distributable income was C$14.6 million, or C$0.18 per share.
Timbercreek declared C$14.3 million, or C$0.17 per share, of dividends, producing a tight 97.7% distributable-income payout ratio.
Expected credit losses increased to C$6.7 million, reducing net income to C$7.8 million.
The C$1.14 billion net mortgage portfolio was 93.9% first mortgages, 81.3% backed by cash-flowing properties, and 60.1% exposed to multifamily residential assets.
Management advanced C$153.5 million into new and existing mortgages during the quarter and continued resolving legacy problem assets.
Two Stage 3 Calgary office and retail properties were sold, helping reduce Stage 3 mortgages by C$28.1 million during the quarter and by 51.1% year-to-date.
Timbercreek maintained its C$0.0575 monthly dividend and also declared payments through year-end.
Coverage remains thin, so redeploying recovered capital, controlling credit losses, and offsetting the portfolio rate decline to 7.6% with lower funding costs will be central to dividend durability.
U.S. investors should also remember that exchange rates affect the dividend’s translated dollar value.
High-Yield Monthly Dividend Stock #13: Stellus Capital (SCM)
- Dividend Yield: 14.1%
Stellus Capital is a business development company providing first-lien, second-lien, mezzanine, and occasional equity capital to U.S. middle-market businesses.
Its loans are generally secured and floating-rate, supporting current income but exposing earnings to lower benchmark rates and borrower credit conditions.
For the second quarter of 2026, total investment income declined 13.2% year-over-year to $22.3 million.
GAAP and core net investment income were both $7.5 million, or $0.26 per share, down from $0.34 and $0.35 per share, respectively.
The portfolio ended June at $968.2 million at fair value, and net asset value was $12.80 per share, nearly unchanged from year-end.
Stellus cut its quarterly distribution to $0.25 from $0.34, a 26.5% reduction. Its October 14th declaration maintained the reduced rate, payable in monthly installments of $0.0833 in November, December, and January.
Core NII narrowly covered the new quarterly rate after failing to cover the prior payout.
Five portfolio companies were on non-accrual at quarter-end, representing 8.5% of portfolio cost. Stellus also continued repurchasing shares below NAV and received a third SBIC license, which can provide lower-cost, long-duration capital.
The lower distribution improves coverage, but weaker earnings, portfolio runoff, credit risk, and sensitivity to floating-rate loan yields still make the 14.1% yield risky.
Investors should require steadier deployment and recurring NII before treating the reset monthly payout as durable.
Deep Dive: Click here to download (for free) our most recent 3-Page Sure Analysis PDF report on Stellus Capital (SCM).
High-Yield Monthly Dividend Stock #12: PennantPark Investment Corporation (PNNT)
- Dividend Yield: 15.7%
PennantPark Investment Corporation provides private credit and equity capital to U.S. middle-market companies.
Its portfolio includes first-lien loans, subordinated debt, government securities, and a sizable equity allocation that can produce gains but increases volatility.
For the fiscal third quarter ended June 30th, 2026, the portfolio totaled $1.19 billion and yielded 11.0% on interest-bearing debt.
Total investment income declined to $24.8 million as the portfolio shrank and its debt yield fell.
Net investment income was $8.9 million, or $0.14 per share, unchanged on a per-share basis from the prior quarter.
Net asset value fell 2.5% sequentially to $6.56 per share.
Four investments were on non-accrual, representing 0.8% of portfolio fair value, while regulatory debt-to-equity was 1.29 times.
PennantPark declared $0.12 per share of base distributions and another $0.12 of supplemental distributions during the quarter.
The current $0.04 monthly base rate annualizes to the spreadsheet’s 15.7% yield; the equal-sized supplement is not included in that figure and should not be assumed permanent.
Quarterly NII covered the base dividend, but only about 58% of the combined payout.
Management is rotating equity proceeds into income-producing debt, which could improve recurring coverage.
Until that transition lifts NII, the supplemental dividend, NAV erosion, and portfolio credit remain the main risks.
High-Yield Monthly Dividend Stock #11: AGNC Investment Corporation (AGNC)
- Dividend Yield: 16.6%
AGNC Investment Corporation is a mortgage REIT that invests primarily in Agency residential mortgage-backed securities.
Credit losses on these assets are largely guaranteed by government-sponsored enterprises, but leverage, funding costs, prepayments, and interest-rate hedges can still produce substantial book-value volatility.
In its October 19th third-quarter release, AGNC reported $0.37 per share of net spread and dollar roll income, down from $0.40 in the second quarter.
That narrowly covered the $0.36 quarterly dividend. However, comprehensive loss reached $1.28 per share as wider mortgage spreads and market volatility outweighed the portfolio’s income.
Tangible net book value fell 16.9% to $7.13 per share from $8.58 at June 30th. Including dividends, the quarter’s economic return was negative 12.7%.
The investment portfolio totaled $94.4 billion, concentrated in Agency mortgage-backed securities and to-be-announced positions.
The $0.12 monthly dividend remains the basis of the 16.6% yield shown here, but a high cash payout did not prevent a substantial quarterly loss in shareholders’ capital.
Agency guarantees limit mortgage credit losses; they do not protect the market value of securities or eliminate leverage and funding risks.
Investors should assess recurring income coverage alongside book-value changes, mortgage spreads, hedging effectiveness, and financing conditions before treating the distribution as dependable.
High-Yield Monthly Dividend Stock #10: CION Investment Corporation (CION)
- Dividend Yield: 17.1%
CION Investment Corporation is an externally managed business development company focused on senior secured loans to U.S. middle-market businesses.
At the end of the second quarter, 79.2% of its $1.65 billion portfolio consisted of first-lien investments across 82 companies and 23 industries.
Second-quarter 2026 total investment income was $49.8 million. Net investment income improved to $14.2 million, or $0.29 per share, from $0.25 in the first quarter.
Net asset value rebounded 3.5% to $13.57 per share, helped by mark-to-market gains on equity investments.
Non-accruals improved to 1.44% of fair value, and net debt-to-equity declined to 1.52 times as sales and repayments exceeded new fundings by $90 million.
CION maintained its $0.10 monthly base distribution for October through December.
Quarterly NII nearly covered the $0.30 payout, a meaningful improvement, but the one-cent shortfall still leaves a limited cushion.
Management repurchased $8.0 million of shares below NAV during the quarter, raised the repurchase authorization to $130 million, and repaid $125 million on its bank facility after quarter-end.
Those actions can improve per-share value and reduce leverage, although a shrinking portfolio can also pressure future interest income.
Investors should watch recurring coverage, realized credit losses, leverage, and the pace of portfolio reinvestment.
High-Yield Monthly Dividend Stock #9: Horizon Technology Finance (HRZN)
- Dividend Yield: 17.9%
Horizon Technology Finance is a business development company specializing in venture debt for technology, life-sciences, healthcare, and sustainability businesses.
It originates senior secured loans and often receives warrants, creating potential equity upside alongside interest income.
Second-quarter 2026 total investment income increased to $25.0 million, but net investment income fell to $7.4 million, or $0.11 per share.
Results included $4.4 million, or $0.07 per share, of non-recurring expenses from the completed merger with Monroe Capital Corporation. Excluding those costs, NII roughly covered the $0.18 regular quarterly distribution.
However, $38.5 million of unrealized depreciation—substantially related to one portfolio company—reduced net asset value to $6.23 per share from $6.98.
Horizon declared regular monthly distributions of $0.06 for October through December, plus $0.03 monthly special distributions funded from spillover income.
The base payout appears more sustainable than the combined $0.09 payment, and spillover income declined to $0.33 per share.
The merger expands Horizon’s balance sheet, with $135 million of cash, $329 million of credit capacity, and a $228 million committed backlog supporting future deployment.
Still, the sharp NAV decline demonstrates the concentrated risk in venture lending.
Credit performance, investment deployment, and recurring NII must improve before we can treat the full distribution rate as durable.
High-Yield Monthly Dividend Stock #8: BCP Investment Corporation (BCIC)
- Dividend Yield: 18.2%
BCP Investment Corporation is an externally managed business development company investing in first- and second-lien loans, mezzanine debt, joint ventures, and selected equity securities of middle-market businesses.
Sierra Crest Investment Management, a BC Partners affiliate, manages the portfolio.
Second-quarter 2026 total investment income declined sequentially to $15.2 million, while net investment income fell to $5.5 million, or $0.45 per share.
That still covered the $0.27 base distribution, but net asset value dropped to $14.49 per share from $15.60. Software and software-exposed holdings accounted for about 47% of the quarter’s unrealized markdowns.
Non-accruals declined from nine portfolio companies to seven, although they increased to 3.1% of investments at fair value.
BCP maintained the $0.09 monthly base distribution for October through December.
Management also refinanced its revolving debt after quarter-end, doubling KeyBank capacity to $150 million, reducing the borrowing spread, extending maturity to 2031, and repaying the JPMorgan facility.
The transaction should improve funding flexibility, while gross borrowings fell during the quarter and asset coverage improved to 162%.
However, NAV has now declined for a second consecutive quarter, and net leverage remained high at 1.6 times.
The regular dividend is well covered by current NII, but portfolio marks, software exposure, non-accruals, and leverage deserve more weight than the headline yield.
High-Yield Monthly Dividend Stock #7: Dynex Capital (DX)
- Dividend Yield: 19.2%
Dynex Capital is an internally managed mortgage REIT that invests mainly in highly liquid Agency residential and commercial mortgage-backed securities.
Its returns depend on the spread between asset yields and funding costs, along with leverage and the effectiveness of its interest-rate hedges.
In its October 19th third-quarter results, Dynex reported earnings available for distribution of $0.38 per share, up from $0.36 in the second quarter.
That still fell short of the $0.51 quarterly dividend. Net loss was $1.34 per share, while comprehensive loss reached $1.49 per share.
Book value fell to $10.91 per share from $12.90, producing a negative 11.5% total economic return after dividends. The quarterly loss reversed the positive return reported in the second quarter.
The investment portfolio grew 3% to $28.3 billion, and leverage, including TBAs at cost, increased to 9.0 times equity from 8.1 times.
Liquidity remained substantial at $1.3 billion, or 42% of equity, but a larger portfolio and higher leverage also increase exposure to unfavorable mortgage-spread moves.
The $0.17 monthly distribution supports the quoted 19.2% yield. Earnings coverage remains incomplete, making book-value preservation, funding access, hedging, and future portfolio returns central to dividend durability.
Deep Dive: Click here to download (for free) our most recent 3-Page Sure Analysis PDF report on Dynex Capital (DX).
High-Yield Monthly Dividend Stock #6: Saratoga Investment Corp. (SAR)
- Dividend Yield: 22.0%
Saratoga Investment Corp. is a business development company that lends to U.S. middle-market businesses.
Its portfolio is dominated by first-lien loans, with smaller allocations to second-lien debt, unsecured loans, structured-finance securities, and equity investments.
In its October 6th release, Saratoga reported fiscal second-quarter 2027 results for the period ended August 31st, 2026.
Total investment income increased 2.0% year-over-year to $31.2 million. Net investment income was $0.45 per share, while adjusted NII was $0.46, down from $0.47 in the preceding quarter.
Assets under management grew 2.1% sequentially to $1.150 billion, supported by $37.1 million of net originations. However, NAV per share fell 4.6% to $22.15 from $23.23, reflecting portfolio markdowns and distributions exceeding earnings.
Adjusted NII covered only about 61% of the $0.75 quarterly distribution, paid in monthly installments of $0.25. Higher refinancing costs and the earnings gap remain important risks despite zero non-accruals at fair value.
Repurchases of 444,124 shares added $0.09 to NAV per share. After quarter-end, Saratoga sold its remaining non-accrual investments and continued refinancing its debt and CLO funding.
The company also announced a finance-leadership transition effective October 31st, with Henri Steenkamp remaining a director and consultant.
The 22.0% yield requires close scrutiny of recurring NII, credit performance, NAV, and the sustainability of distributions above current earnings.
High-Yield Monthly Dividend Stock #5: ARMOUR Residential REIT (ARR)
- Dividend Yield: 23.2%
ARMOUR Residential REIT invests primarily in leveraged Agency residential mortgage-backed securities.
Government-backed credit protection limits default risk, but rates, mortgage spreads, prepayments, financing costs, and hedging results can cause sharp swings in earnings and book value.
In its October 21st third-quarter release, ARMOUR reported a $327.0 million net loss attributable to common shareholders, or $2.26 per share.
Distributable earnings were $102.3 million, or $0.71 per share, just below the $0.72 of common dividends declared during the quarter.
Book value declined to $14.55 per share from $17.53 at June 30th. Including dividends, total economic return was negative 12.9%, showing how capital losses can outweigh a large cash payout.
The portfolio ended September at about $21.3 billion, primarily in Agency mortgage-backed securities, with smaller Treasury and TBA positions.
ARMOUR maintained its $0.24 monthly common dividend for November, payable on November 27th. That rate underlies the spreadsheet’s 23.2% yield.
The latest quarter offered little recurring earnings cushion, and the steep book-value decline is a more serious concern than the one-cent distributable-earnings shortfall alone.
Investors should monitor mortgage spreads, funding costs, hedging results, leverage, and share issuance, alongside dividend coverage. Agency credit protection does not insulate a leveraged portfolio from market-value losses.
High-Yield Monthly Dividend Stock #4: Orchid Island Capital (ORC)
- Dividend Yield: 24.9%
Orchid Island Capital is an externally managed mortgage REIT that invests on a leveraged basis in Agency residential mortgage-backed securities.
Its portfolio includes pass-through and structured Agency RMBS, so earnings and book value are highly sensitive to mortgage spreads, rates, prepayments, and hedging.
In its October 22nd third-quarter results, Orchid reported a net loss of $178.9 million, or $0.90 per share, including $231.7 million of realized and unrealized losses on mortgage securities and derivatives.
Book value fell to $6.02 per share from $7.22 on June 30th. Including $0.30 of quarterly dividends, total return was negative 12.47%.
Net interest income was $59.1 million, or $0.30 per share, before $0.03 per share of operating expenses. Comparing net interest income alone with the dividend therefore overstates recurring coverage.
Orchid maintained its $0.10 monthly dividend in its October declaration, payable on November 27th. The payout remains below the $0.12 monthly rate paid before April’s reduction.
Liquidity was $515.7 million, or about 44% of equity. The company repurchased 4.95 million shares during the quarter and another 1.67 million through the October update.
The 24.9% yield comes with substantial exposure to mortgage spreads, leverage, funding markets, and hedging performance. Sustainable returns require both recurring income and protection of book value.
High-Yield Monthly Dividend Stock #3: Prospect Capital (PSEC)
- Dividend Yield: 26.0%
Prospect Capital is a large business development company providing debt and equity capital to U.S. middle-market businesses.
Its portfolio includes senior secured loans, subordinated credit, structured products, and real estate investments, creating diversification but also considerable valuation and credit complexity.
For the fiscal fourth quarter ended June 30th, 2026, net investment income was $77.7 million, or $0.15 per share, compared with $0.16 in the prior quarter.
Net asset value declined to $5.71 per share from $6.05 in March, and the company recorded a $38.1 million net loss applicable to common shareholders.
For the full fiscal year, NII was $0.68 per share, down from $0.77 one year earlier.
Prospect declared monthly common distributions of $0.035 per share for September and October, equal to $0.105 over three months.
Latest quarterly NII would cover the reduced $0.105 quarterly dividend run rate, but the continuing decline in NAV and per-share income remains a major warning sign. Sure Analysis projects fiscal 2027 NII of $0.38 per share, below the current $0.42 annual dividend run rate.
Management has increased first-lien senior secured loans and continues exiting selected real estate holdings, which may simplify the risk profile over time.
The company also reported that six property exits during the fiscal year generated an 18% unlevered gross cash internal rate of return.
Even so, investors should scrutinize non-accruals, payment-in-kind income, external-management fees, and NAV before treating the 26.0% yield as dependable income.
Deep Dive: Click here to download (for free) our most recent 3-Page Sure Analysis PDF report on Prospect Capital (PSEC).
High-Yield Monthly Dividend Stock #2: Invesco Mortgage Capital (IVR)
- Dividend Yield: 26.8%
Invesco Mortgage Capital is an externally managed mortgage REIT focused primarily on Agency residential and commercial mortgage-backed securities.
It finances these assets with repurchase agreements and uses derivatives to manage interest-rate exposure, making book value and earnings sensitive to spreads, leverage, and hedging.
In its October 29th third-quarter results, Invesco reported a $98.8 million net loss attributable to common shareholders, or $0.92 per share, compared with $0.34 of net income in the second quarter.
Earnings available for distribution declined to $0.47 per share from $0.50, despite net interest income rising to $33.9 million from $30.1 million.
That measure covered the $0.36 quarterly common dividend, but book value fell 16.1% to $6.74 per share from $8.03. Economic return was negative 11.6% after dividends.
Economic debt-to-equity increased to 8.3 times from 7.5 times, while GAAP debt-to-equity rose to 7.6 times from 6.3 times.
The company shifted capital from Agency commercial mortgage securities toward Agency residential mortgage securities and raised $51.0 million through common-share issuance.
The $0.12 monthly dividend supports the quoted 26.8% yield, but income coverage alone does not establish safety when book value is falling sharply.
Investors should monitor leverage, liquidity, mortgage spreads, hedging, and the combined effect of dividends and capital gains or losses on total return.
High-Yield Monthly Dividend Stock #1: Oxford Square Capital (OXSQ)
- Dividend Yield: 44.7%
Oxford Square Capital is a business development company investing in senior secured debt, collateralized loan obligation equity, and smaller equity positions.
CLO equity can generate substantial cash income, but it is complex, cyclical, and sensitive to defaults, loan prices, and financing conditions.
In its October 30th third-quarter release, Oxford Square reported total investment income of $9.9 million, up from $9.4 million in the second quarter.
Net investment income fell to $4.9 million, or $0.04 per share, from $5.1 million, or $0.05 per share. NAV declined to $1.21 per share from $1.29.
The most significant development is an announced dividend cut. The board declared $0.015 per share monthly for January, February, and March 2027, down 57.1% from the $0.035 monthly payments scheduled through December.
The quoted 44.7% yield uses the spreadsheet’s $0.42 annual dividend input. At the same $0.94 share price, the newly declared $0.18 annualized rate would yield about 19.1%.
Third-quarter NII covered only about 38% of the old quarterly payout and remained slightly below the new $0.045 quarterly rate.
The company also issued 14.1 million shares, raising $19.4 million. Investors should assess per-share earnings, NAV erosion, credit quality, and CLO cash flows alongside the reduced future distribution.
Final Thoughts
Monthly payments can make portfolio income easier to match with recurring expenses, but payment frequency does not make a dividend safer.
This ranking is best used as a research shortlist rather than a list of automatic buys, as every Top 20 security currently carries an F Dividend Risk Score in the Sure Analysis Research Database.
Most of the companies are BDCs or mortgage REITs, whose payouts depend on credit quality, funding costs, leverage, portfolio yields, and changes in NAV or book value.
Gladstone Commercial is the only property-owning REIT in the current Top 20. Its long leases and high occupancy support cash flow, but office exposure, tenant credit, and financing costs still create payout risk.
Several quoted yields reflect only regular base dividends, while supplemental payments can be reduced and Himalaya Shipping’s cash distributions vary with freight-market conditions.
Stellus Capital’s 26.5% distribution reduction and Oxford Square’s announced 57.1% cut from January demonstrate how quickly a headline yield can reset when recurring earnings fail to cover the prior payout.
Before considering any name, compare its regular payout with recurring earnings, examine recent NAV or book-value trends, and review leverage, non-accruals, liquidity, and distribution history.
The largest quoted yields, particularly Oxford Square’s 44.7% based on payments scheduled through December, signal substantial market concern and should receive the greatest scrutiny.
Further Reading
If you are interested in finding high-quality dividend growth stocks and/or other high-yield securities and income securities, the following Sure Dividend resources will be useful.
- Dividend Kings: 50+ years of rising dividends
- Dividend Champions: 25+ years of rising dividends
- Dividend Aristocrats: 25+ years of rising dividends and in the S&P 500
- High Dividend Stocks: 4%+ dividend yields
- Monthly Dividend Stocks: Individual securities that pay out every month
- Royalty Stocks: Detailed royalty stocks list
- MLPs: Detailed MLP list
- REITs: Detailed REIT list
- BDCs: Detailed BDC list